With FrontFace, you can transform ordinary screens into powerful dashboards and shop floor boards. This software allows you to visualize live data, KPIs, and BI metrics from your systems in near real time on info screens, digital signage displays, and interactive touchscreens. It's ideal for Industry 4.0, production, administration, and call centers!
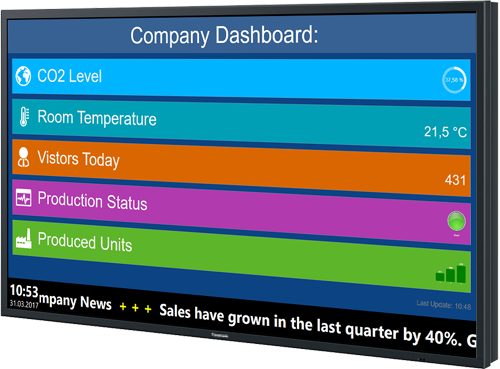
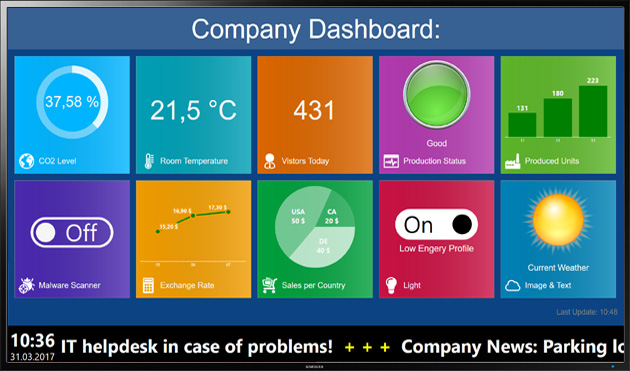
Key Company Figures on BI Dashboards
Digital dashboards make KPIs (key performance indicators) and BI (business intelligence) data instantly understandable. Management and administrative and production employees can see the current company situation at a glance on a single information screen — no need for complex reports or intranet searches.
Shopfloor Dashboards for Production Data

In production, shop floor boards provide real-time data on output, target achievement, and process status directly on the production line. This simplifies production planning and control while continuously improving quality through digital shop floor management. The displays can also be used to share information with employees.
Visualization of Key Figures for Plants and the Environment
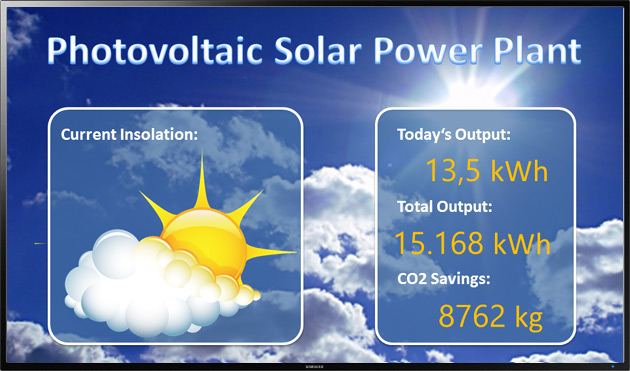
An information screen makes performance and control data visible, whether it's solar systems, energy consumption, or other environmental data. This promotes transparency and demonstrates a commitment to sustainability!
Capacity Displays in Call Centers and Services
A call center dashboard shows queues, available agents, and sales targets in real time. This improves customer communication and makes employee management more efficient.
Data Visualization Options in FrontFace:
- Dashboards with the standard FrontFace functionality:
With FrontFace, you can create a dashboard in just a few clicks, no programming knowledge required! You can embed PDFs or web pages directly and present your content dynamically. One of its particular strengths is the placeholder function. It allows you to integrate live data from XML, JSON, or text files. This ensures that your dashboards are automatically updated and always show the latest information. - Dashboard Plugin:
The Dashboard Plugin is an optional extension that adds powerful visualization capabilities to the FrontFace software. It allows you to display key figures from a central XML data file located on a file or web server in real time. You can customize the display to match your corporate identity without any programming knowledge. You can generate the XML file directly from your database or backend system, and it will be updated automatically at any interval. - Power BI Integration:
The Power BI plugin for FrontFace allows you to display Microsoft Power BI reports and dashboards directly on digital signage screens and interactive touch terminals. This allows you to display your business intelligence data exactly where it's needed — clearly and interactively!
The advantages at a Glance:
- Create dashboards quickly without programming
- Live data integration via XML, JSON or text files
- Integration of PDFs, websites and Power BI reports
- Flexible adaptation to design and corporate identity
- Real-time visualization of your key figures
With FrontFace, you get a powerful yet easy-to-use digital signage solution that presents your data in a visible, understandable, and attractive way at all times!
- Download the fully-functional, free trial version.
- Watch the quick start videos (installation and usage of the software).
- Download the plugins "Dashboard" and/or "Power BI".
- Learn more about the FrontFace software (pricing, license model) and also about "hardware".